Trading, Price Action and Technical Analysis for Beginners
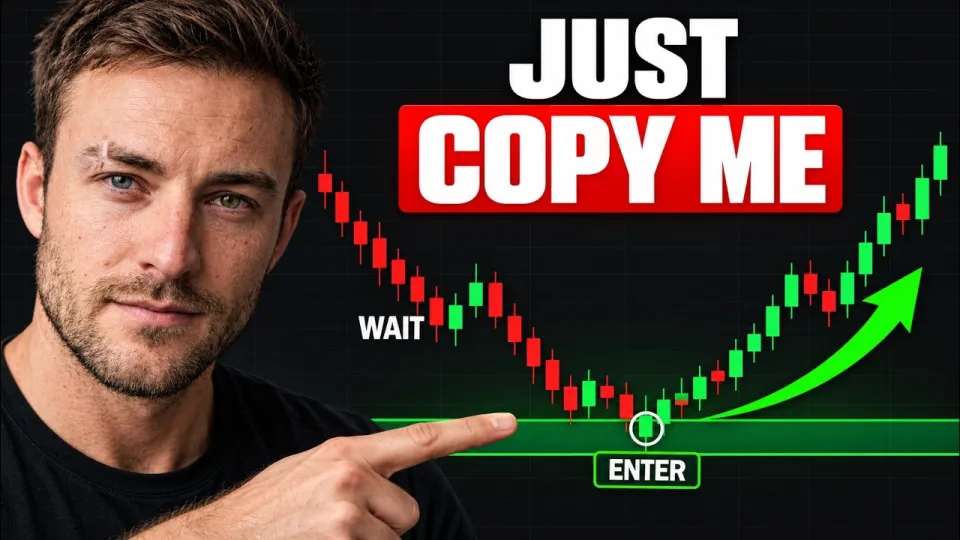
Video: Price Action Trading Makes Sense Once You Understand Technical Analysis
· based on the channel Trade with Smoke FX
Key takeaways
- Price action trading focuses on raw price movement, using support/resistance and candlestick patterns instead of lagging indicators.
- Technical analysis helps identify key levels and trends; combine with volume to confirm breakouts and avoid false signals.
- Risk management is critical: define stop-loss and take-profit levels before entering any trade.
- Tools like AI scanners and RSI can streamline analysis but should complement, not replace, your own chart reading.
- Free trading communities, such as the one linked, offer forecasts and educational resources for beginners.
Trading with price action and technical analysis is a method of reading raw price charts to identify key levels and make informed decisions without relying on lagging indicators. It involves marking support and resistance, analyzing candlestick patterns, and using volume to confirm entries and exits. For beginners, joining a free trading community can provide valuable forecasts and support.
What Is Price Action Trading and Why Does It Matter?
Price action trading is the study of historical and real-time price movements to predict future direction. Unlike indicator-based strategies, price action relies on the actual price chart, making it a purer form of technical analysis. Key concepts include support and resistance levels, trendlines, and candlestick patterns. By understanding these, traders can spot potential reversals or continuations. For example, a bearish candlestick pattern at a resistance level often signals a selling opportunity. Price action works across all markets—forex, crypto, futures—and timeframes, making it versatile for day trading and swing trading.
How to Identify Support and Resistance Levels
Support and resistance are price levels where the market tends to reverse or consolidate. To identify them, look for areas where price has previously bounced or stalled multiple times. A resistance level is a ceiling where sellers overpower buyers, while support is a floor where buyers step in. When marking these levels, use recent swing highs and lows, and consider round numbers (e.g., 1.1000 in EUR/USD) as psychological barriers. The more times a level is tested without breaking, the stronger it becomes. Combine with volume analysis: a breakout above resistance with high volume is more likely to be valid.
Step-by-Step Guide to Building a Trade Setup
- Scan the market: Use tools like an AI scanner or manually review major pairs (e.g., USD/JPY, EUR/USD) to find potential setups.
- Mark key levels: Identify support and resistance on higher timeframes (e.g., 1-hour or 4-hour).
- Check volume: Confirm that volume supports the price movement—rising volume on breakouts, falling volume on retracements.
- Look for candlestick patterns: At key levels, wait for reversal patterns like pin bars or engulfing candles.
- Set entry, stop-loss, and take-profit: Enter near the level, place stop-loss beyond the recent swing, and set take-profit at the next opposing level.
- Manage the trade: Monitor volume and price action; adjust stop-loss to breakeven if the trade moves favorably.
Common Questions from Beginners
New traders often wonder if price action alone is sufficient or if they need indicators. While price action is powerful, combining it with volume and occasionally indicators like RSI can improve accuracy. Another common question is how to avoid false breakouts: wait for a candle close beyond the level and confirm with volume. Many also ask about the best timeframes—start with higher timeframes (1-hour, 4-hour) to reduce noise, then move to shorter ones as you gain experience. Finally, beginners often struggle with risk management; always risk a small percentage (1-2%) of your account per trade.
Using Volume and RSI to Confirm Entries
Volume indicates the strength behind a price move. A breakout above resistance with high volume is more reliable than one with low volume. RSI (Relative Strength Index) measures momentum and can signal overbought (above 70) or oversold (below 30) conditions. For example, if price hits resistance and RSI is overbought, a reversal is more likely. However, RSI can remain overbought in strong trends, so use it as a secondary confirmation. In the video, the trader checks volume before entering a EUR/USD put, and later uses RSI on Binodex to validate setups.
Tools and Resources for Price Action Traders
Beyond charting platforms, traders can use AI scanners to quickly identify potential setups across multiple assets. These scanners analyze price action and volume to flag opportunities. For crypto and futures, platforms like Binodex offer RSI and other indicators. The video mentions free Telegram forecasts and an AI Market Scanner. Additionally, joining a community can accelerate learning through shared analysis and real-time alerts. Always remember that tools are aids—your understanding of price action remains the core.
Risk Management and Trading Psychology
Effective risk management is the cornerstone of successful trading. Define your risk per trade (e.g., 1% of capital) and stick to it. Use stop-loss orders to limit losses and take-profit orders to lock in gains. Avoid moving stop-losses further away in hopes of a recovery. Trading psychology also plays a role: fear and greed can lead to impulsive decisions. Stick to your plan, keep a trading journal, and review your trades regularly. The video emphasizes managing a USD/JPY put trade by adjusting stops and taking partial profits.
Conclusion
Price action trading, combined with technical analysis, provides a robust framework for understanding market movements. By mastering support and resistance, volume analysis, and risk management, beginners can build a solid foundation. The video by Trade with Smoke FX demonstrates these concepts in live trading, from marking levels to executing trades. For those looking to learn more, consider joining the free trading community for forecasts and support. Remember, trading involves risk; always educate yourself and trade responsibly. Also, check out the platform where the trader executes trades: bdclick.app/smart/smoke.
Questions & answers
Do I need to use indicators if I trade price action?
No, price action can be traded without indicators, but using volume and occasionally RSI can provide additional confirmation. Indicators like RSI help gauge momentum, while volume confirms the strength of breakouts. However, relying solely on price action is a valid approach if you master support/resistance and candlestick patterns.
How do I avoid false breakouts when trading support and resistance?
Wait for a candle close beyond the level and check volume. A true breakout is typically accompanied by high volume, while false breakouts often occur on low volume. Additionally, consider the overall trend and use higher timeframes to filter out noise.
What is the best timeframe for beginners to start trading?
Beginners should start with higher timeframes like 1-hour or 4-hour charts to reduce noise and identify clearer levels. Once you gain experience, you can move to shorter timeframes for day trading. The principles of price action apply across all timeframes.
How much should I risk per trade?
A common rule is to risk 1-2% of your trading capital per trade. This ensures that a series of losses doesn't wipe out your account. Always set a stop-loss at a logical level based on price action, and never risk more than you can afford to lose.
Source: Price Action Trading Makes Sense Once You Understand Technical Analysis · Markdown version